Well Click Through Readers, just when we think Google can’t get any better… it does.
This week is all about Google.
A new migration tool has been rolled out to save us time as we start moving over from Universal Analytics to Google Analytics 4.
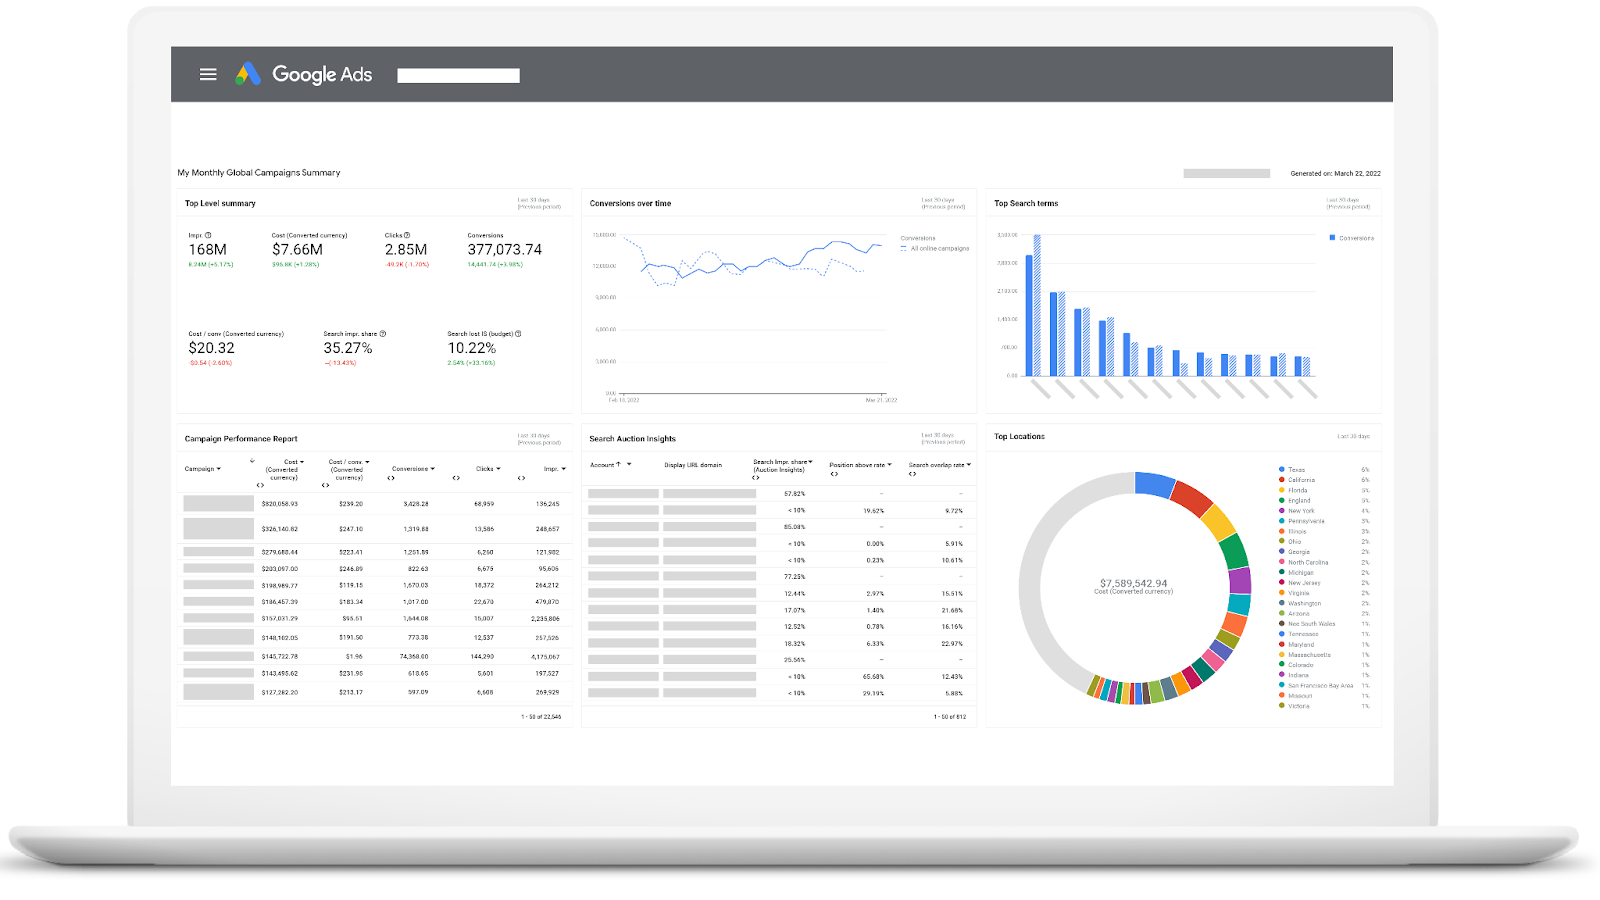
While we’re working on getting everything in one place, Google also released a new Account Dashboard. Catch any opportunities or issues in any of your accounts by viewing them all in one place. Additionally, new dashboard customization features were released to make these views work for you.
Dashboard customization isn’t the only thing getting updated: new features and capabilities were also released in the custom columns tool. Edit your columns as you would in a spreadsheet; apply formulas, compare metrics across date ranges, and so much more!
Get the full scoop below!
Google Rolls Out Conversion Migration Tool for GA4
Google has recently rolled out a UA to GA4 migration tool that automatically migrates your Universal Analytics goals to Google Analytics 4. Not all advertisers have access, but it will be rolling out to all accounts in the near future.
As of now, only destination goals and event goals can be migrated using this tool. Page-per-session goals, screens-per-session goals, duration goals, smart goals and any others that use regular expressions cannot be migrated as of this time.
Ultimately, this could save advertisers a lot of time when they move and set up everything in the new GA4 platform. Advertisers are hopeful more migration tools or integrations will become available before July, 2023, when Google Analytics 4 will replace Universal Analytics.

New Ways to Customize Your Columns in Google Ads

Google Ads recently launched an update to custom columns, giving advertisers an easier way to see the most crucial information to their business goals. Historically, these custom columns have allowed advertisers to view column breakouts by conversion, device and network. Now, these columns are becoming even more powerful.
With the new features, users can:
- Use multiple filters to one formula.
- Insert spreadsheet functions to produce a return value based on the parameter input. Similar to capabilities in spreadsheet software, you can utilize new column formats such as “True/False,” “Text,” and “Date.”
- Reference other custom columns in a formula.
- Use non-metric columns in your formula, such as Budget, Campaign Name, etc.
- Calculate and compare metrics across date ranges, allowing you to set up columns to quickly diagnose which campaigns and ad groups are hitting specific metrics and goals for given periods of time.
- Filter by your conversion custom variables.
Over the next few weeks, advertisers will also have the ability to access any columns created in custom reporting tools such as Report Editor and Dashboards.
Google’s New Manager Account Dashboards
Google released a new update, allowing advertisers to review performance across multiple accounts, all in one place. Use dashboards at the management level to spot potential problems and opportunities across multiple accounts.
Google also made several improvements to dashboards, so users can now:
- Change date ranges and filters for the dashboard as a whole
- Add interactive table cards
- Change formatting features and conditional formatting
- Download reports faster and at a higher quality
- Copy over existing saved reports, and more
To get started, go to the “Reports” menu in your Google Ads manager account and click on “Dashboards.”
